Home

Trade Lab · Research

Position P&L Curve

How trading platforms turn open positions into a live P&L timeline, with targets, stop-loss thresholds, benchmarks, and performance metrics in one view.

What is position p&l curve

A position P&L curve plots how the combined profit or loss of selected open positions changes through the trading session.

It helps traders see whether risk is moving toward a target or stop loss, identify drawdowns, and compare portfolio performance with an underlying asset or benchmark.

How the market solves it

1 competitor compared

Fyers

Web

Context. Fyers presents the curve as a live portfolio-risk surface rather than a static total. Mohan K documented this public reference, and I curated it in AgentUX for Trade Lab research.
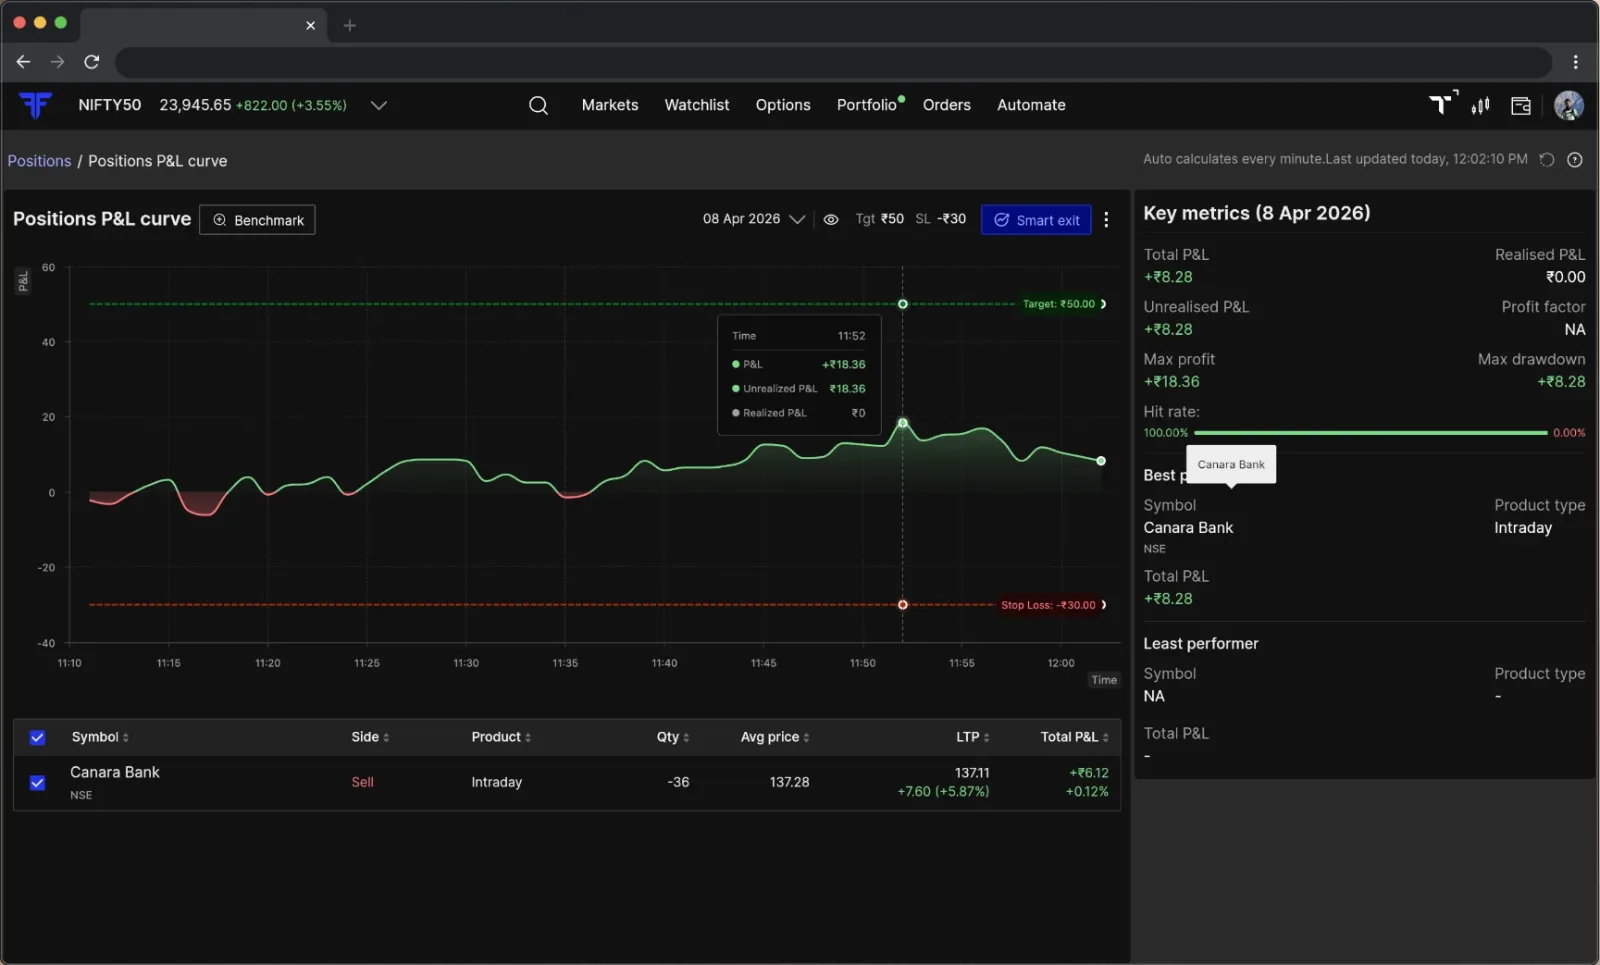
Fyers web interface showing a live positions P&L curve with target and stop-loss thresholds, key metrics, and an open-position table.

The default curve keeps total, realised, and unrealised P&L on one timeline, with target and stop-loss thresholds, key metrics, and contributing positions alongside it.

View on AgentUX
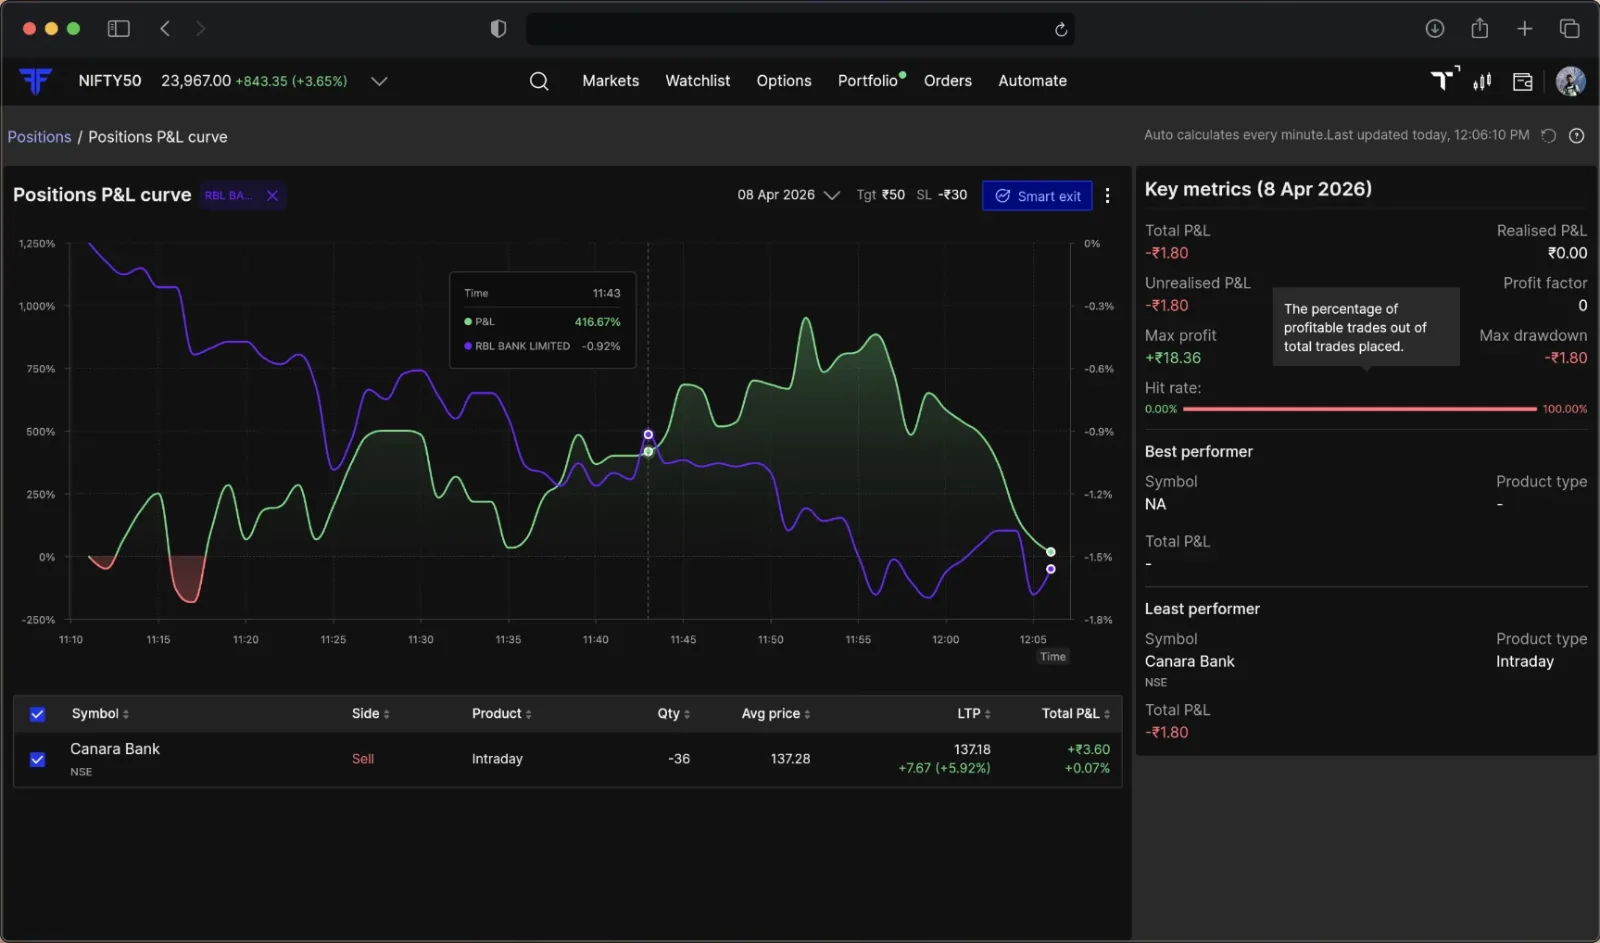
Fyers web interface comparing a positions P&L curve with the selected instrument on a second percentage scale.

Benchmark mode overlays the selected instrument on a second scale, helping traders judge whether their P&L is moving with or against the market.

View on AgentUX

Next

Back to the research pages.

Open Research