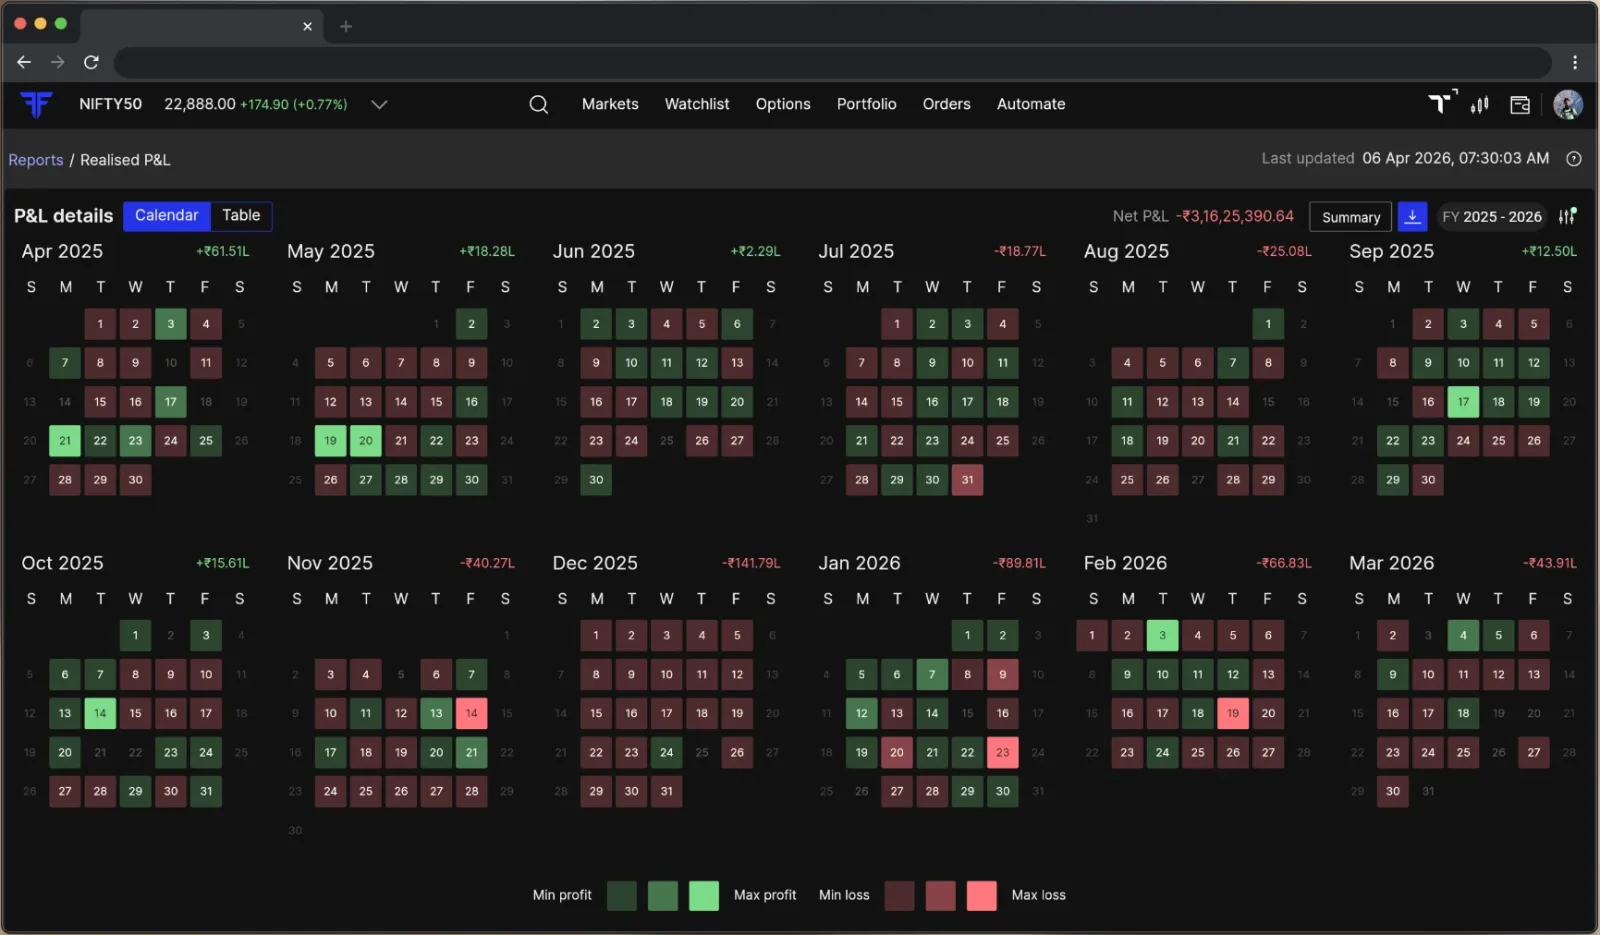
How trading platforms turn closed-trade outcomes into a calendar that reveals profitable days, loss-heavy periods, and monthly performance at a glance.
What is realised p&l calendar
A realised P&L calendar maps completed trading outcomes to the days they occurred, then groups them into a longer performance history.
It helps traders spot consistency, streaks, and unusually strong gains or losses without reading every trade in a report table.
How the market solves it
1 competitor compared
Fyers
Web
Context. Fyers turns realised P&L into a fiscal-year heatmap for faster performance review. Mohan K documented this public reference, and I curated it in AgentUX for Trade Lab research.
The fiscal-year heatmap groups daily outcomes by month, uses colour intensity for magnitude, and adds monthly totals so traders can scan profitable and loss-heavy periods before opening the table view.